<PROJECTS />
PROJECTS IN THIS CATEGORY (3)
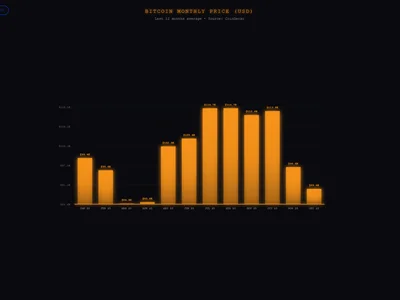
Crypto Monthly Price Chart
Real-time cryptocurrency price visualization with animated bar chart. Track Bitcoin, Ethereum, Solana, Cardano, and Dogecoin monthly averages using CoinGecko API data.

Multi-Dataset Pie Chart
Interactive donut chart with multiple real-world datasets. Explore World Population by continent (REST Countries API), Browser Market Share, and GitHub Programming Languages statistics with smooth animated transitions.

System Metrics Monitor
Real-time system performance visualization with toggleable metrics. Monitor CPU, Memory, Network, Disk and GPU usage with animated line graphs and customizable display options.